
Late this week, the US Federal Reserve (Fed) lowered official interest rates by 50 basis points (bps), to 4.75–5.00%. The median projection by the Federal Open Market Committee (FOMC) is for an additional 100bps of cuts in 2025 on top of a further 50bps of cuts through to the end of this year (i.e., 200bps in total, which is slightly above the 250bps the market had pencilled in). In this Special report, we look at how the equity market has reacted at the start of previous rate-cutting cycles, and what it means this time round.
The market is now braced for an additional seven to eight cuts by the end of 2025.
The Fed first began exiting the COVID era of ultra-loose monetary policy in March 2022, raising official interest rates 11 times, at one of the fastest paces on record. Rates had been held at 5.25-5.50% for over 12 months, allowing restrictive monetary policy to work its way through the US (and global economy). In turn, this helped bring the Fed’s preferred measure of core inflation back to 2.6%, its lowest level since March 2021.
Economic growth indicators continue to decline and have set off increased cross-asset volatility (albeit September data, despite still surprising negatively, have not missed by as much as the prior month). Equity market price action continues to favour the likelihood of a soft-landing for the US economy, while other markets, such as commodities and rates, have reacted more to incremental growth fears.
With the Fed now equally (if not more) focused on the other side of its dual mandate - employment - the market is now braced for an additional seven to eight cuts by the end of 2025 (~3%). Without wanting to oversimplify the task ahead, much of the debate will centre upon whether the world’s largest economy succumbs to a recession over the next six months. Again, simplistically, out of the last 12 easing episodes, eight were accompanied by a recession and four by a soft landing.
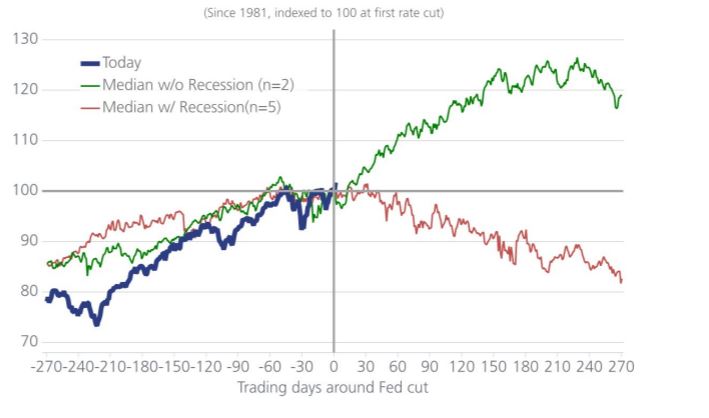
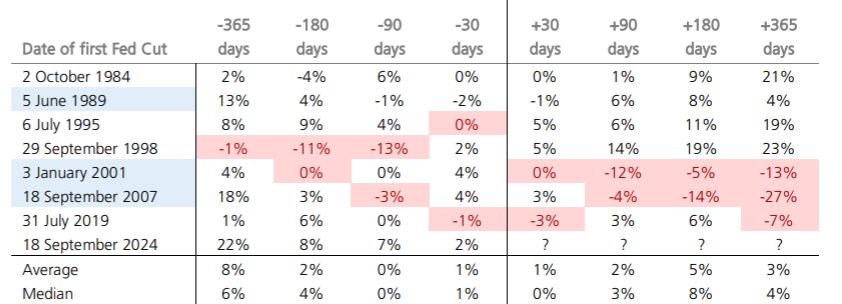
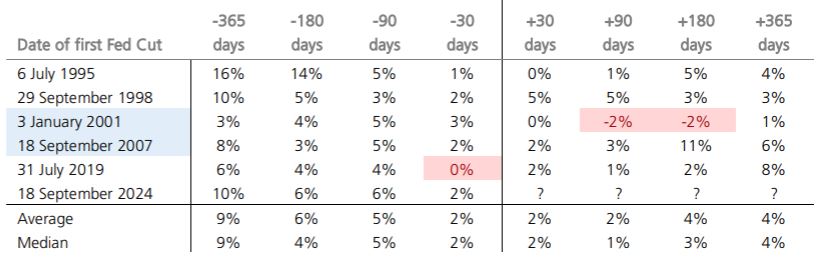
Historically, the initial equity market reaction to the start of rate cuts has tended to be rather muted, but subsequent performance has diverged significantly.
Historically, the initial equity market reaction to the start of rate cuts has tended to be rather muted, but subsequent performance has diverged significantly, depending on which growth outcome prevailed. Longer term, equity performance following the start of a Fed easing cycle has been largely contingent on the growth outcome. A soft or no-landing scenario has seen equities deliver very strong returns, while recessions have usually seen equities show absolute weakness for a number of months after the cuts began.
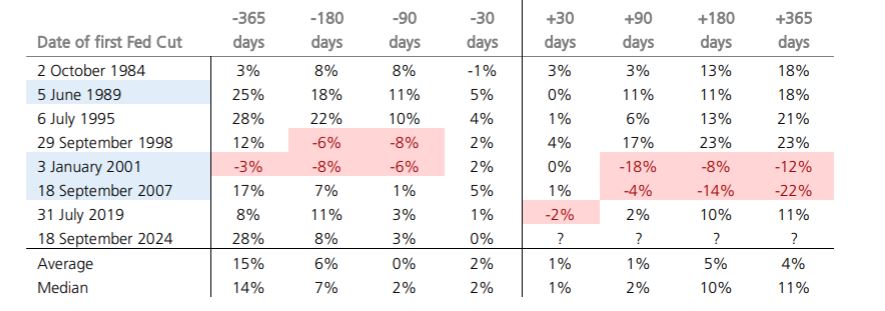
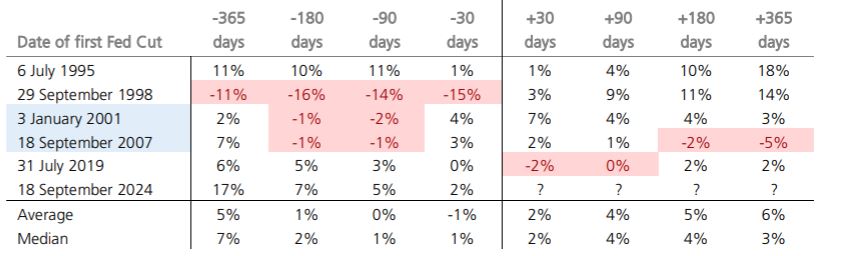
One key difference this time around is that the S&P 500 Index is already up 28% in the last 12 months. This is much more than the 4% gains made by the index in the run up to the last 12 Fed easing cycles, on average. This could suggest that, even in a soft-landing scenario, S&P 500 returns could be relatively muted this time, given the elevated starting point. Notwithstanding this, 1989 and 1995 saw very similar returns in the lead up to the first rate cut, 25.3% and 27.7% respectively, and both episodes were still able to generate very strong 12-month forward returns.
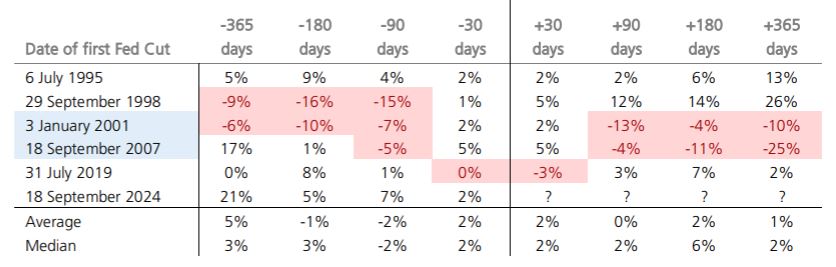
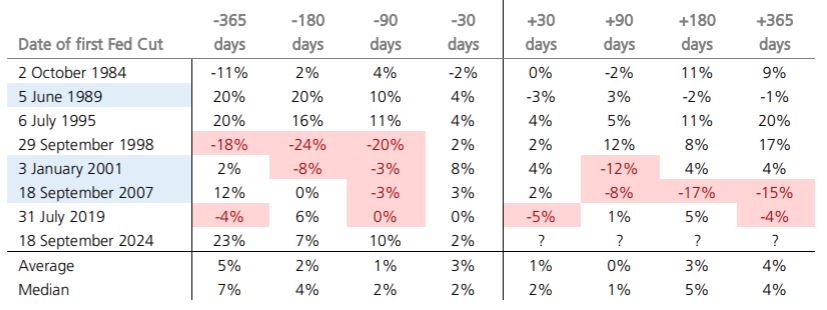
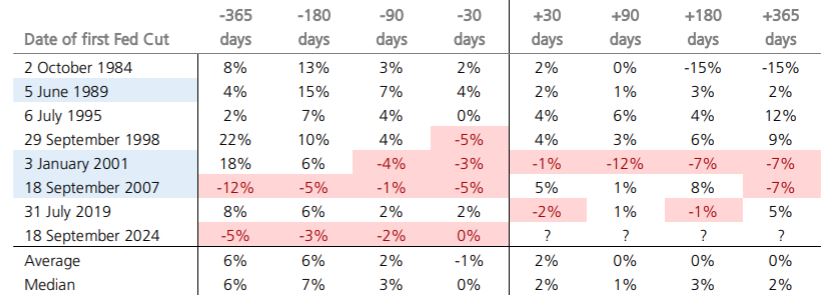
By factor, both growth and value have shown a tendency to deliver positive returns in the 12 months following a Fed rate cut. However, again this hinges on whether a recession was forthcoming or not. Relative performance across mid-cap and small-cap equities has been variable, irrespective of whether a recession occurred. Mid-caps outperformed large caps in 1998 (no recession) and 2001 (recession) but underperformed in other instances. Small-cap returns have tended to be volatile, and the 2019 rate-cutting cycle suffered from COVID distortions. During the GFC and DotCom bubble, small caps were able to materially outperform large caps, although prior cycles showed no tendency for outperformance.
This time around, however, analysts believe that falling rates will be a critical support for smaller-sized companies. 49% of Russell 2000 (small caps) debt is floating versus only 20% of the S&P 500 debt. Small cap remains abnormally cheap (on a price/earnings and price/book basis) and in the case of the US, they appear to be discounting much higher credit spreads and weaker growth already.
At a sector level, pharmaceuticals, health care, consumer staples, software, and consumer discretionary have tended to exhibit positive one-year forward outperformance versus the market. Banks and insurance have tended to underperform.
This time around, analysts believe falling rates will be a critical support for smaller-sized companies.
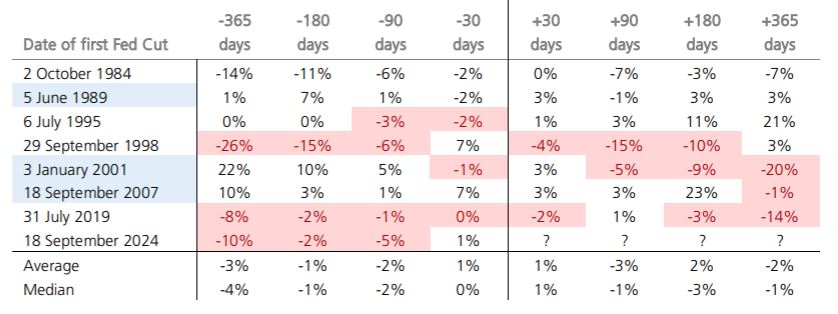
Across other assets, commodities have tended to exhibit very muted one-year forward returns. Outside of 1995, the Bloomberg Commodity Index has generated a one-year forward return after the first cut of ~3% to -19%. Investment grade and high yield bonds have shown a strong tendency to deliver positive absolute returns. The US dollar has shown a tendency to weaken half the time after the first rate cut.
Receive ongoing access to LGT Wealth Management’s insights and observations - a curated stream of thought leadership, market perspectives, and strategic updates designed to inform sophisticated investors.