
Smoothing an investor's return profile through the cycle has always been a key rationale for constructing diversified portfolios. And this has never been more important in a world that appears to be rapidly changing. Many of the norms and conventions of the past several decades - regimes that we have become familiar with - are seemingly under threat.
As we have discussed previously, the geo-political backdrop is becoming more multi-polar, with the US uni-polar hegemony under threat. Increased social inequity is driving more populist and nationalist government policies, while demographics, the energy transition and generative artificial intelligence (AI) are presenting both challenges and opportunities. Building ‘resilient' portfolios, in an era of greater macro and market volatility (across and within asset classes) has never been more crucial.
In this month's Core Offerings, we provide an overview of our approach to constructing equity portfolios. We discuss the strategies and styles we adopt to maximise opportunity and build resilience in portfolios, as well as some of the pitfalls investors should be aware of.
When building equity portfolios, we typically categorise managers or strategies into three buckets. These are 'core low risk', 'mid risk', and 'high-risk satellite'. This helps us frame how strategies fit into a multi-manager portfolio, and enables us to size them appropriately.
As we discuss in more detail below, when building equity portfolios, we typically categorise managers or strategies into three buckets: These are ‘core low risk', ‘mid risk', and ‘high- risk satellite'. This helps us frame how strategies fit into a multi-manager portfolio and enables us to size them appropriately. As strategies can behave differently in the short term, blending them can lead to a smoother return profile over the cycle.
However, as a starting point, it is important to establish the objectives of a portfolio before formulating the best approach to effectively meet those objectives. As an example, while equity portfolios are typically designed to outperform the benchmark over the cycle (after fees), some portfolios may be required to target income with an element of defensiveness, while others may be focused on maximising growth over the long term.
These varying elements can - and should be - taken into consideration when designing a multi-manager equity portfolio. Other risk-related objectives may also be incorporated, such as limiting ex-ante tracking error (for example, to 3% through the cycle) or generating consistent alpha (1.5-2.0% through the cycle). Once we frame these objectives, we can then formulate the ideal combination of strategies to help us achieve this.
Quantitative techniques should help investors resist the urge to add unnecessary strategies that are not necessarily optimising the portfolio. Unnecessary over- diversification can be costly, dampening outperformance and increasing portfolio redundancy.
Having a blend of differentiated manager strategies is one way an investor can ensure a portfolio can participate in opportunities, regardless of the market conditions (and a shifting secular environment). Different strategies (for example, concentrated or benchmark aware) will, at times, have greater success in delivering returns. Similarly, having a broad representation of strategies, which aggregates near neutral, can mitigate the impact on performance if one particular strategy is dominating.
Having a filtered universe of managers that has already passed due diligence (in our case, via LGT Crestone's fund due diligence team) is also a good starting point for building portfolios with greater confidence. It also makes sense to think about how we combine managers, to ensure they complement each other. Indeed, how strategies interact should be assessed quantitatively, with a focus on the correlation of their holdings and returns in different environments (more on this below).
Finally, these quantitative techniques should also help investors resist the urge to add unnecessary strategies, which are not necessarily optimising the portfolio. Unnecessary over-diversification can be costly, dampening outperformance and increasing portfolio redundancy (i.e., the same security or dominant style across multiple managers).
Different styles tend to perform better in different market regimes (when different 'factors' are responsible for market performance). However, over a full market cycle, they should balance out.
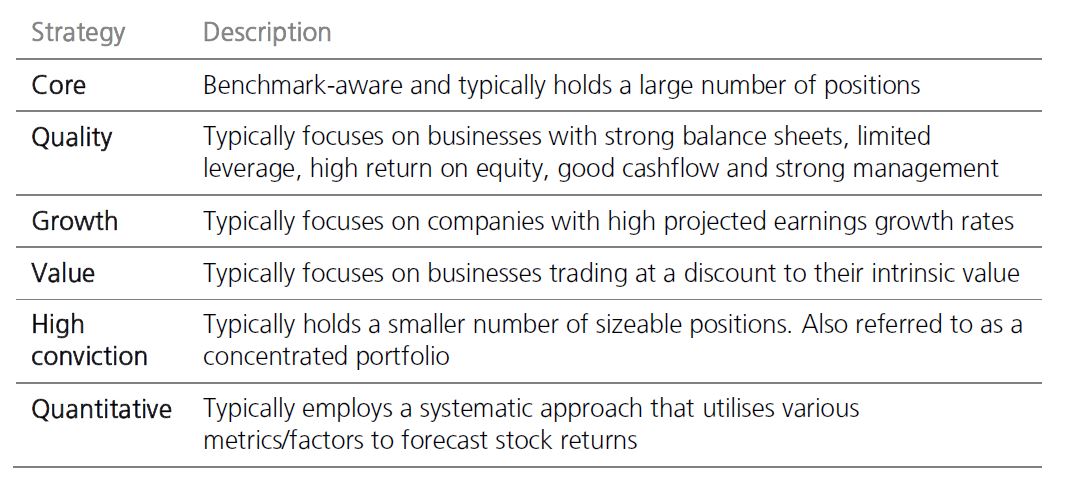
We can also embrace a further layer of complexity by taking into consideration various strategy styles, as well as their investment universe coverage. The key styles we consider are reflected in the table below. While there can be overlaps, some of the broad definitions of our strategies and styles are summarised below.
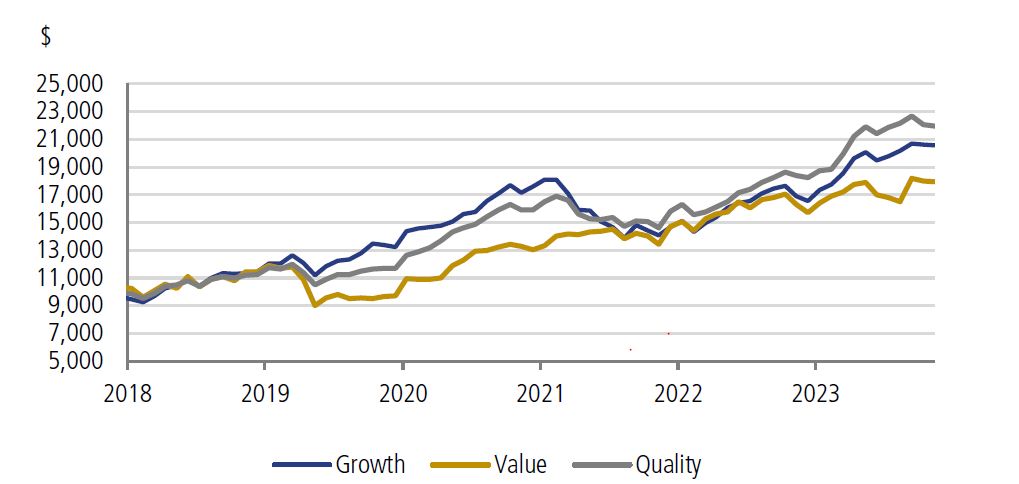
Different investment styles tend to work better in different market regimes (when different ‘factors' are responsible for market performance). However, over a full market cycle, they should balance out. An example of this was in 2022, when the onset of the US Federal Reserve's (Fed) tightening cycle proved a significant headwind for growth-style strategies, but was a tailwind for value strategies. However, over time, we do tend to see these macro
-driven forces even out, with a greater focus on company/business-specific metrics.
The chart below illustrates how these three styles have performed over the past few years. If an investor was invested fully in growth, the journey would have been more treacherous, despite having experience a very strong past 12 months.
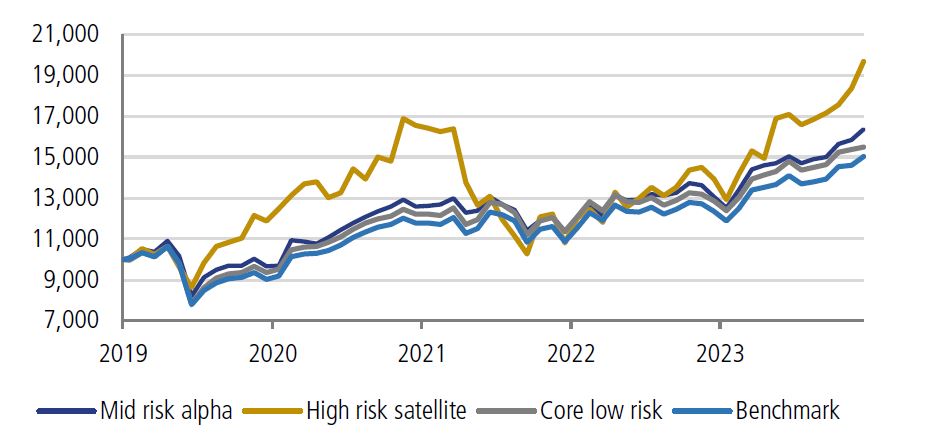
We typically categorise strategies into three risk- return segments—namely, 'core low risk', 'mid risk' and 'high-risk satellite'. The overall objectives of the portfolio will help formulate the ideal weightings to each segment.
Bringing this all together, when we are building portfolios, we typically categorise strategies into three risk-return segments, namely ‘core low risk', ‘mid risk' and ‘high-risk satellite'.
The overall objectives of the portfolio will help formulate the ideal weightings to each segment. As an example, a defensive portfolio with a low risk tolerance will be skewed towards core low risk and might not require higher risk satellite strategies. On the other hand, a portfolio with an aggressive risk profile and high risk tolerance will potentially have a higher allocation to mid-risk and satellite strategies, so it can generate higher levels of long-term outperformance. We define these segments and their typical weight ranges as:
Our three-bucket risk approach is applicable to all asset classes. Within fixed income, it would be reflected in how we allocate to benchmark bond managers through to our willingness to take on ‘active risk' via a concentrated credit manager.
Sizing different strategies is key to generating a smoother return profile for the asset class. Allocating the risk budget to return drivers should be proportional to the attractiveness of the opportunity from a risk- return perspective.
Sizing different strategies is key to generating a smoother return profile for the asset class. Allocating the risk budget to return drivers should be proportional to the attractiveness of the opportunity from a risk-return perspective. Assessing active risk-a strategy's potential contribution to performance variability-is a common approach to sizing strategies in a portfolio. For example, a small-cap strategy (which would reside within the high-risk satellite bucket), which had a tracking error of 10% to the benchmark and a weight of 10%, has an active risk of 1%. If the overall active risk of the portfolio is 4% then this strategy is contributing 25% to the active risk budget.
For most portfolios this would be a high level of active risk for a single strategy. According to Cambridge Associates, capping active risk at around 0.50% for individual strategies is ideal. Thus, instead of weighting strategies equally (which can lead to a sub-optimal outcome), we can use active risk to manage and target the desired risk level. This can be achieved by reducing the allocation to strategies with high active risk and focusing on lower tracking error strategies.
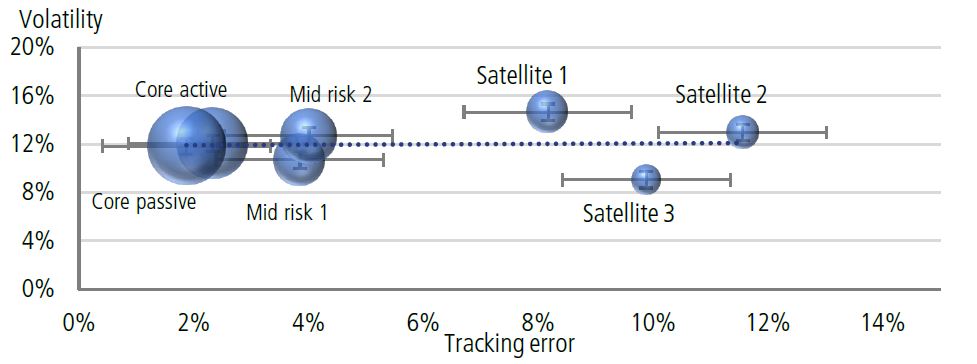
At LGT Crestone, we use a quantitative and qualitative approach when sizing strategies. The quantitative process utilises a proprietary framework that incorporates each strategy's tracking error (i.e., variation in performance to the benchmark), its volatility over a market cycle, and its expected alpha. This process helps determine where a strategy sits in our three-bucket approach (strategies with low active risk tend to fall into the core component, while those with high active risk will be in the satellite component). The table and chart below illustrate how the process works. In this case, the proportional interaction between the strategy's tracking error and volatility forms the initial basis of the sizing.
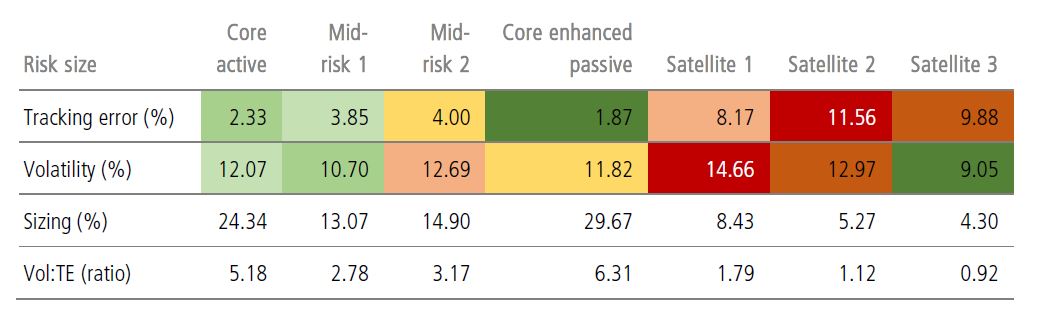
We use a quantitative and qualitative approach when sizing strategies. The quantitative process utilises a proprietary framework that incorporates each strategy's tracking error, its volatility over a market cycle, and its expected alpha.
As the table (above) and chart (over) illustrate, the output places greater credence in the strategies with lower levels of benchmark variability. Subsequent allocations to mid-risk and satellite strategies are expected to have more active risk, but generate alpha over a cycle.
Looking at the example below, the quantitative process results in 54% being core, 28% mid risk and 18% satellite. This is a low risk outcome, which leaves some room to increase the mid-risk component for alpha opportunities.
While we do blend parts of the portfolio with passive strategies, particularly the core component, we typically utilise active (non- ETF) strategies. These are often called ‘enhanced passive’ strategies, and can provide superior downside protection and capital preservation.
While the basis and majority of our process is quantitative, we also employ a qualitative overlay, which draws on our team's knowledge of the underlying strategies and how they have behaved over time. As our team is in constant dialogue with fund managers, they can provide insight into business level issues, process changes, team turnover, or a problematic position. The team maintains a scorecard of LGT Crestone's recommended strategies, which ranks strategies according to risk levels across multiple dimensions. Similar to the quantitative process, a higher weighting is allocated to low-risk strategies.
While we do blend parts of the portfolio with passive strategies, particularly the core component, we typically utilise active (non-exchange-traded fund (ETF)) strategies. These are often called ‘enhanced-passive' strategies, and can provide superior downside protection and capital preservation. In the example above, the enhanced-passive element is around 30% of the portfolio. The low tracking error of these strategies leads many quantitative approaches to allocate a greater weight to them to lower benchmark risk. It is necessary, thus, to make adjustments to ensure the portfolio can also achieve its return (and other) objectives. For example, (higher return) mid-risk strategies tend to have a lower correlation to the benchmark, suggesting they may not participate in as much downside as passive.
There are benefits to complementing active strategies with some passive exposure, particularly in parts of the portfolio where we can access cheap beta. This is primarily in the core low- risk parts of the portfolio, where we have a low tolerance for high tracking error.
Investors have three options when it comes to implementing portfolios-active, passive management, or a combination of both. As we've noted, active management can provide outperformance over benchmarks, provide downside protection, and enhance diversification. However, there are benefits to complementing active strategies with some passive exposure, particularly in parts of the portfolio where we can access cheap beta.
This is primarily in the core low-risk parts of the portfolio, where we have a low tolerance for high tracking error. The balance can also be varied, depending on the level of fee tolerance and desired risk-return objectives from the asset class. Higher fee sensitivity lends itself more towards lower-cost passive and direct equities. ETFs can also make it easier to implement tactical shifts more efficiently in a portfolio of managed funds when it comes to short-term opportunities. This can take the form of regional opportunities and currency hedging. ETFs can also be utilised to balance out factor risks, manage portfolio beta against the benchmark, and avoiding selling active strategies at an inopportune time.
We utilise a quantitative and qualitative approach to formulate how we build portfolios and size strategies appropriately. Portfolios and markets are fluid and, at points in the cycle, some metrics can drift. It is, therefore, prudent to continue reviewing portfolios frequently and adjust accordingly.
At LGT Crestone, we take a systematic and fundamental approach to monitoring and managing risks. Our starting point is monitoring for unintended biases to specific factor risks-this includes style, yield, liquidity, and size. We utilise systems, such as Morningstar, to monitor and review portfolios, and continuously review portfolios to ensure they are within their prescribed risk limits. In reality, strategies perform differently through the cycle, which means there could be times when a specific strategy dominates the portfolio's overall profile. In many cases, rebalancing will help solve for this.
At LGT Crestone, we believe the key is to ensure the portfolio is well diversified across styles, regions and market capitalisation, as this will ensure it is best placed to deliver attractive risk-adjusted returns without being overly dependent on a particular outcome. We utilise a quantitative and qualitative approach to formulate how we build portfolios and size strategies appropriately. Portfolios and markets are fluid and, at points in the cycle, some metrics can drift. It is, therefore, prudent to continue reviewing portfolios frequently and adjust accordingly.
Receive ongoing access to LGT Wealth Management’s insights and observations - a curated stream of thought leadership, market perspectives, and strategic updates designed to inform sophisticated investors.