
For most people - even the devotees of the FT - reading about technical analysis can be about as exciting as watching paint dry. However, the sharp market moves following the US midterms have prompted us to tackle the subject anyway. Beneath the headline index returns lies an evolving market structure where we believe that the recent falls may reflect a healthy rotation in market leadership rather than a wider market sell-off or investors shifting to the safety of cash. By rotation, we mean investors shifting their attention from one area of the market to another. Whether it persists or not is another question.
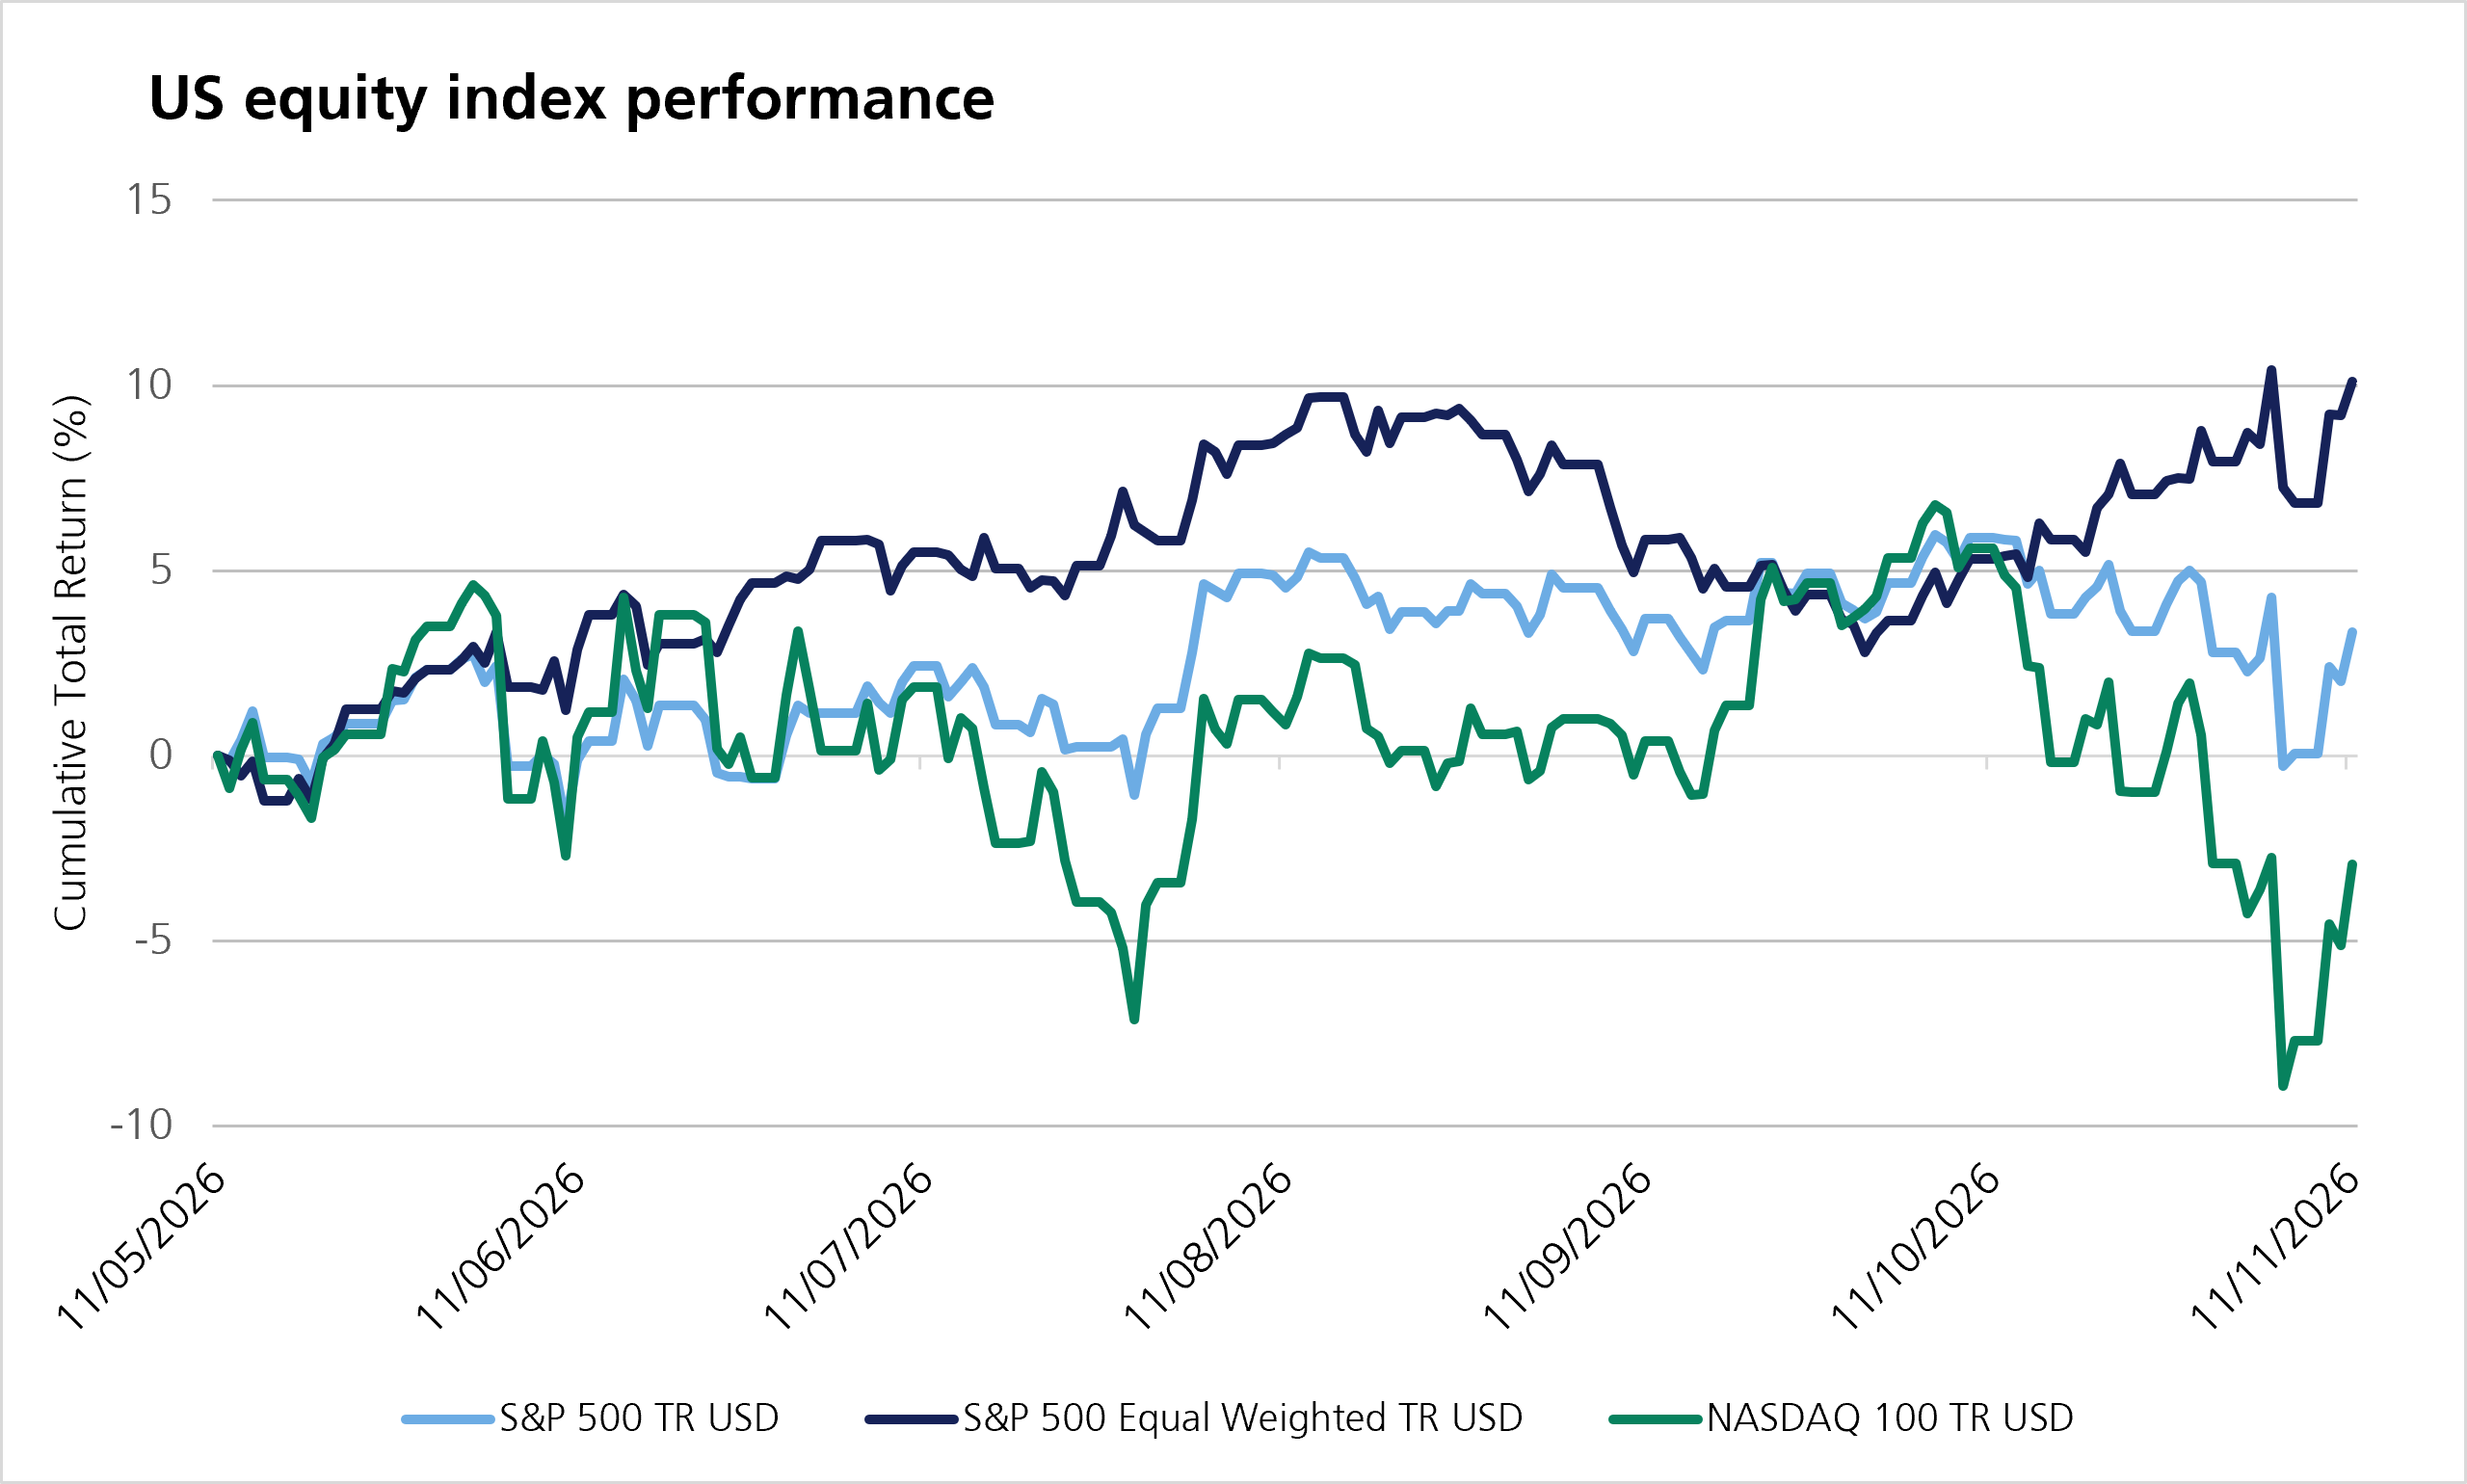
We believe this is one of the most notable rotational markets in recent memory. Rather than shares moving up or down together, leadership has been changing rapidly, with yesterday’s winners falling out of favour, while neglected parts of the market are attracting attention. The last week or so, since the results of the US midterms, has brought this rotation into sharp focus. But the story did not start with the midterms. As the chart below shows, signs of this rotation appeared over the summer, and the shifts accelerated in October. So, what is happening under the bonnet?
The distinction between an index’s returns and the performance of its underlying stocks can be particularly revealing. For example, despite the recent Nasdaq decline, 61.7% of S&P 500 constituents were trading above their own 200-day moving averages at the end of October. In other words, most shares remained above a widely watched measure of their longer-term trend. This reading predates the midterms and suggests that signs of broader participation were already visible before the election. Another recent reading of market breadth showed around half of S&P 500 constituents reaching 20-day highs, even while AI-related shares remained under pressure. These readings could change, but for now the weakness among yesterday’s leaders is coinciding with gains elsewhere.
Because the S&P 500 weights companies by market value, falls in a few heavyweight stocks can disproportionately affect both the headline index and the headlines it generates - even when many other constituents are advancing. The S&P 500 Equal Weight Index, which gives each company approximately the same weight, offers a useful comparison: it remains close to its all-time high despite the recent decline in its market-cap-weighted counterpart. This divergence is consistent with rotation between sectors rather than indiscriminate weakness across equities. We would view this broadening of market leadership as a positive development.
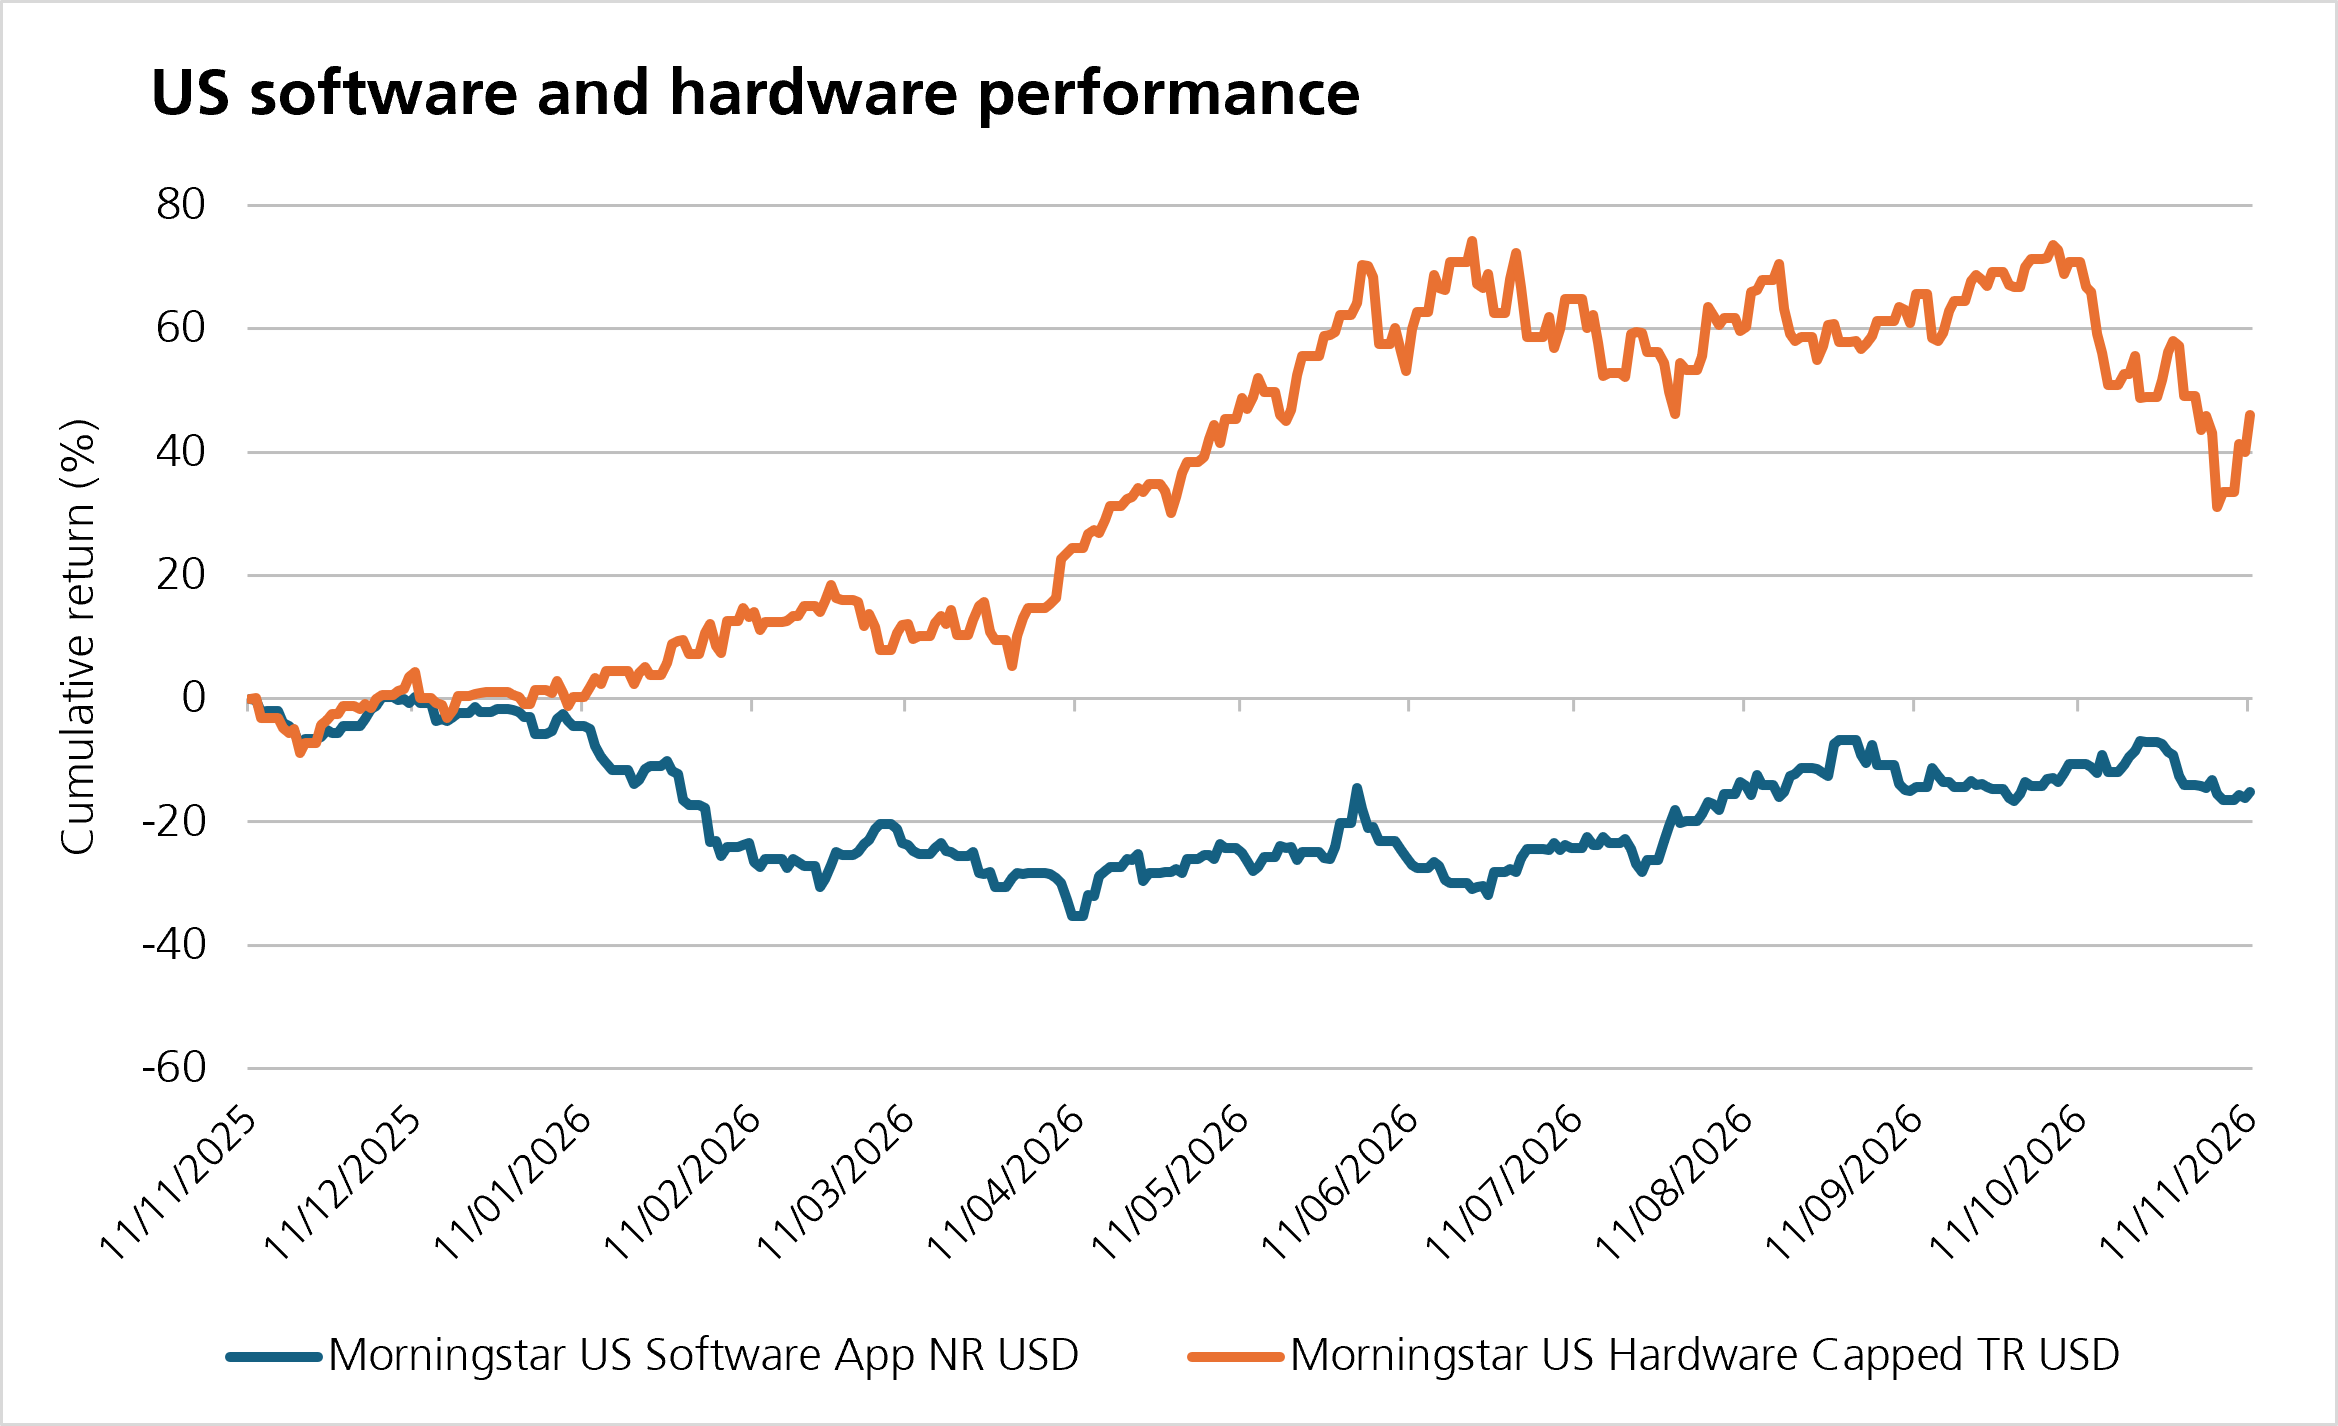
Technology is often discussed as though it were a single investment theme. This year has shown otherwise, with clear winners and losers emerging across its subsectors. Software companies, semiconductor manufacturers, data-centre operators, and large platforms have different business models, valuations and vulnerabilities. For much of the recent AI boom, investors rewarded companies expected to benefit from building the infrastructure: chips, computing power and data centres. These hardware and infrastructure businesses led through the first half of the year, while software came under pressure.
More recently, however, that leadership has begun to reverse. As the chart below shows, some hardware and infrastructure names have come under pressure, while parts of software and the large platforms have attracted renewed interest. One possible explanation is that investors are reassessing the balance between the substantial spending required to build AI infrastructure and the returns that spending will ultimately generate. The midterms have also raised questions about future data-centre regulation. How this trend plays out could have a big impact on how markets move on from here.
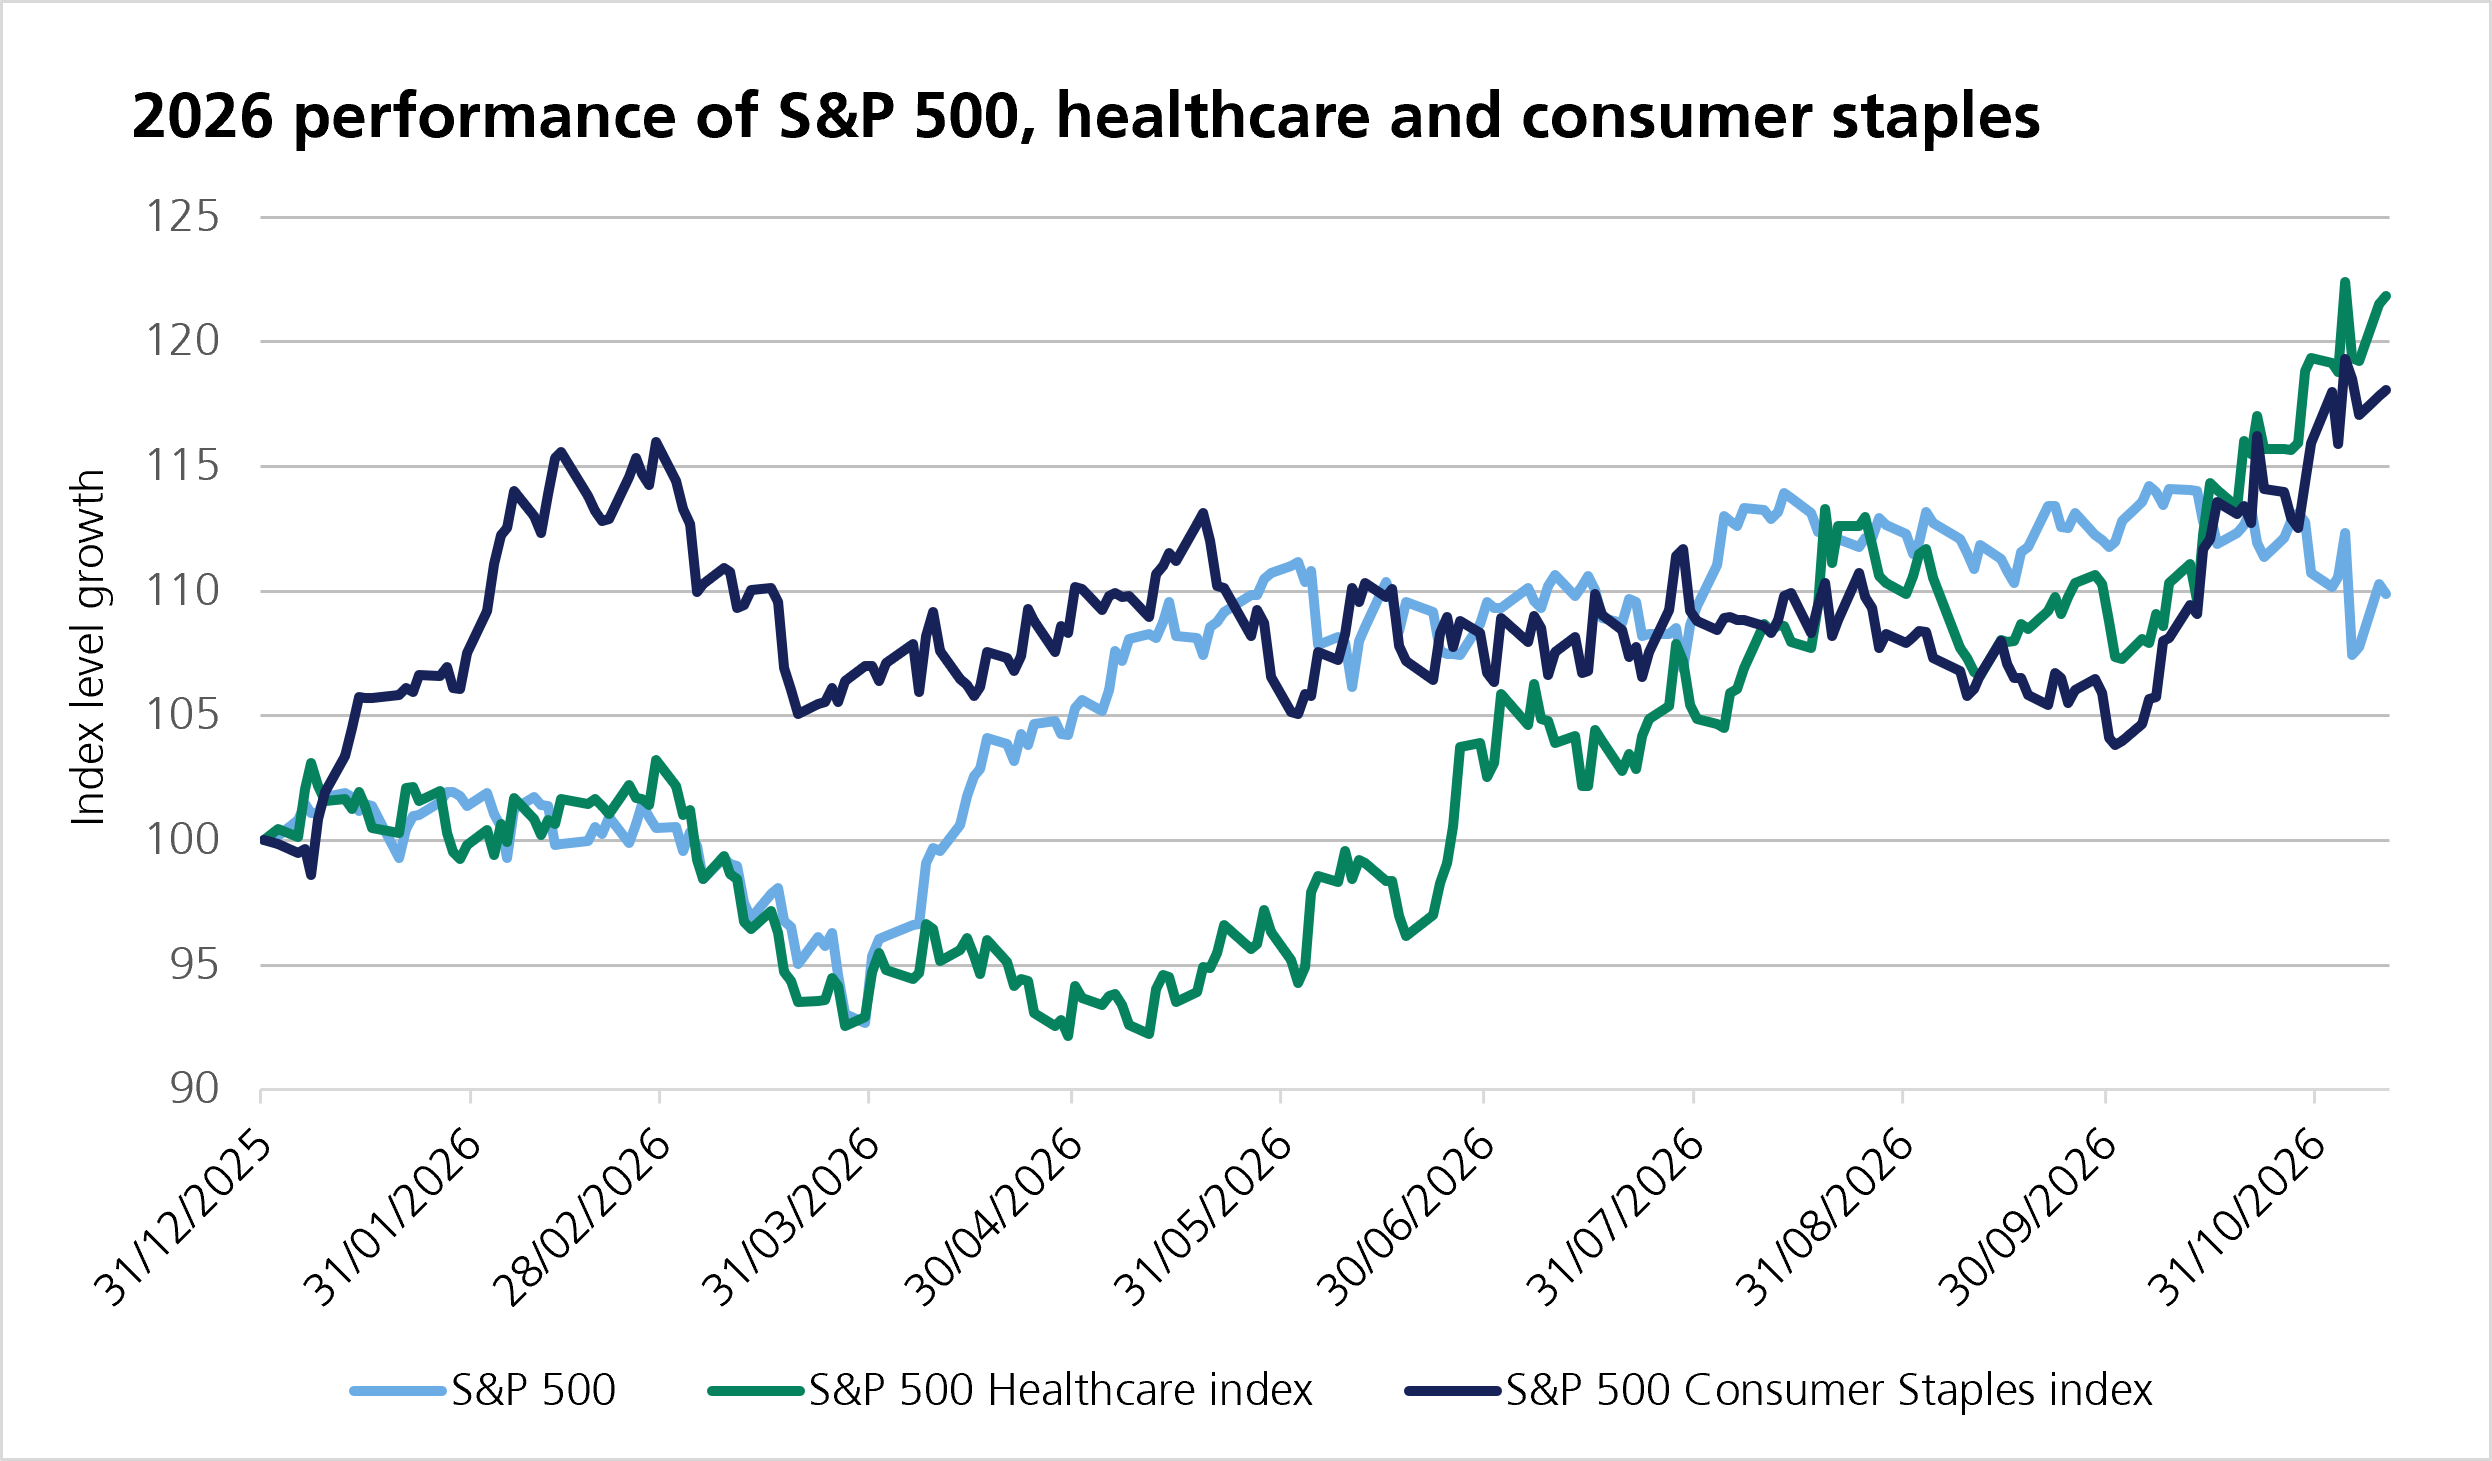
The rotation extends beyond technology. Global consumer staples rose 10.6% in October, while healthcare gained 9.8%. Alongside insurance, these sectors have attracted renewed attention after spending years in the shadow of the market’s growth darlings. Consumer staples represented approximately 14% of the S&P 500 in 2009; by January 2026, their weight had fallen to 4.6%. By September, staples and consumer discretionary together accounted for just 13% - a 36-year low. This illustrates how much their representation in the index has diminished.
Investors may therefore hold hundreds of companies through an index fund, yet have relatively little exposure to everyday consumer businesses compared with previous decades. Meanwhile, portfolios that track indices weighted by company size have inherited the growing concentration in technology and AI-related stocks. That is a substantial change in what owning “the market” means.
So why are these more defensive sectors attracting attention now? Defensive sectors are often seen as relatively resilient during periods of economic uncertainty, although their shares can still fall in value. Investors may be rebalancing towards neglected areas while reassessing the spending commitments, valuations and potential disruption associated with AI. Businesses whose earnings depend less directly on the AI investment cycle offer a different set of exposures. There may also be a more conventional explanation: in an uncertain environment, investors place greater value on dependable demand and relatively predictable earnings. Staples, healthcare and parts of insurance can often offer those characteristics. The rotation may therefore reflect both a reassessment of technology and a rediscovery of what the rest of the market has to offer.
The returns achieved by headline indices like the S&P 500 so far this year belie the significant scale of the moves beneath the surface. Even when a small number of large companies come under pressure, other areas of the market can perform differently. Following the midterms, we believe it is too early to make a wholesale pivot in portfolio strategy, particularly while markets remain volatile. Our view has been to have meaningful exposure to bonds and equities outside the US which are both potential diversifiers if leadership broadens beyond US technology.
The midterms may nevertheless mark the continuation of a more durable shift in leadership. We remain alert to that possibility and can adjust portfolios if the evidence warrants a change of course. For now, the evidence points to a highly rotational market but it is uncertain whether it will persist. If a broader range of companies, including previously overlooked businesses with attractive valuations, were to lead market gains, we would view that as healthy. It could also mark the start of an environment where active management starts to outperform passive indices again. The challenge is distinguishing a lasting change from a noisy change in sentiment.
This communication is provided for information purposes only. The information presented herein provides a general update on market conditions and is not intended and should not be construed as an offer, invitation, solicitation or recommendation to buy or sell any specific investment or participate in any investment (or other) strategy. The subject of the communication is not a regulated investment. Past performance is not an indication of future performance and the value of investments and the income derived from them may fluctuate and you may not receive back the amount you originally invest. Although this document has been prepared on the basis of information we believe to be reliable, LGT Wealth Management UK LLP gives no representation or warranty in relation to the accuracy or completeness of the information presented herein. The information presented herein does not provide sufficient information on which to make an informed investment decision. No liability is accepted whatsoever by LGT Wealth Management UK LLP, employees and associated companies for any direct or consequential loss arising from this document.
LGT Wealth Management UK LLP is authorised and regulated by the Financial Conduct Authority in the United Kingdom.