
When you’re debating investing in a company, it’s natural to focus on the big numbers – is revenue growing? Are profit margins healthy? While these metrics are important, they don’t tell you the whole story. There’s another important question worth asking: How much of the company do you actually own? It’s easy to overlook, but your stake in a business can quietly shrink over time, even while the company itself is thriving. The pie gets bigger, but somehow your slice gets smaller.
There are many reasons why companies issue shares. A fast-growing business might need to raise capital to fund their expansion – building factories, entering new markets, or expanding overseas. Technology companies often pay employees with stock rather than cash. This helps the company save cash today while also attracting top talent. When a company wants to make an acquisition, issuing shares can be an efficient way to finance the deal without draining their cash or piling on more debt. None of this is problematic – it is simply part and parcel of doing business.
But it does come at a cost. Every time new shares are created, existing shareholders get diluted. In other words, the company and its earnings are now divided amongst more shareholders, which means your piece of pie shrinks slightly.
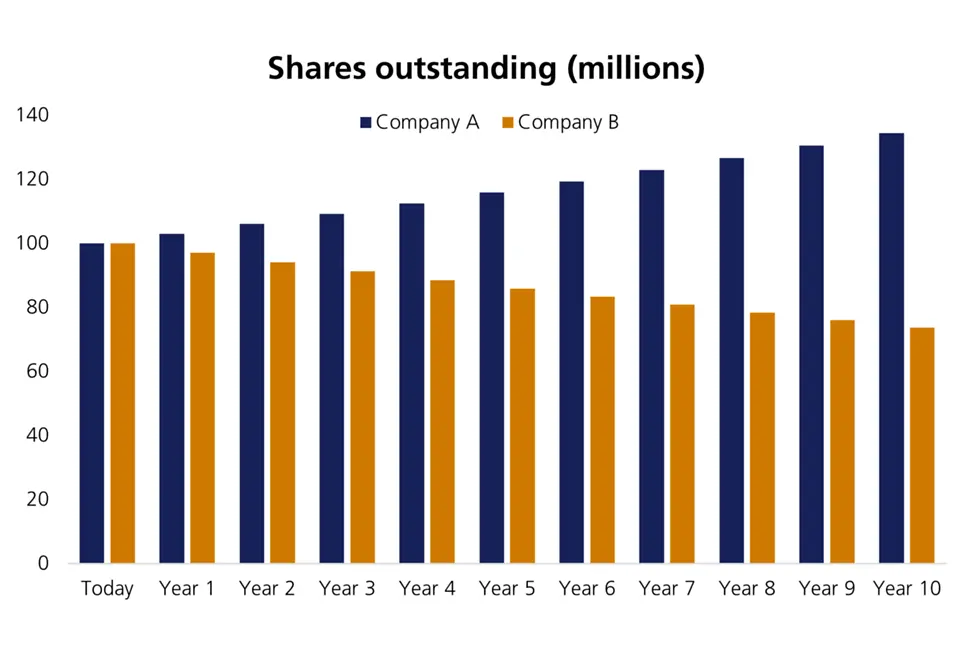
Let’s look at two hypothetical companies – Company A and Company B. Both start with £1 billion in sales, £200 million of earnings, and 100 million outstanding shares (the total number of a company’s stock currently owned by all shareholders but excluding any shares the company bought back). Both grow their sales and profits at a steady 5% per year. On paper, these companies are identical. However, there is a crucial difference – Company A issues 3% more shares every year to fund its growth and compensate employees, while Company B buys back 3% of its shares annually.
At first glance, you might assume these companies will have similar fates. After all, they are growing at the same pace. But let’s fast forward ten years – we are long-term shareholders after all – and examine what’s happened.
Both companies have growth sales 5% annually from £1 billion to £1.63 billion, and earnings from £200 million to £326 million.
Company A, after issuing shares every year has grown its share count from 100 million to over 134 million, whereas Company B has reduced its share count from 100 million to less than 74 million over 10 years.
While both these companies started with an earnings per share (EPS) of £2, after ten years Company A has an EPS of £2.42 – a growth rate of only 1.9% per year. In contrast, after ten years, Company B has an EPS of £4.42 – representing an impressive 8.2% of EPS growth per year.
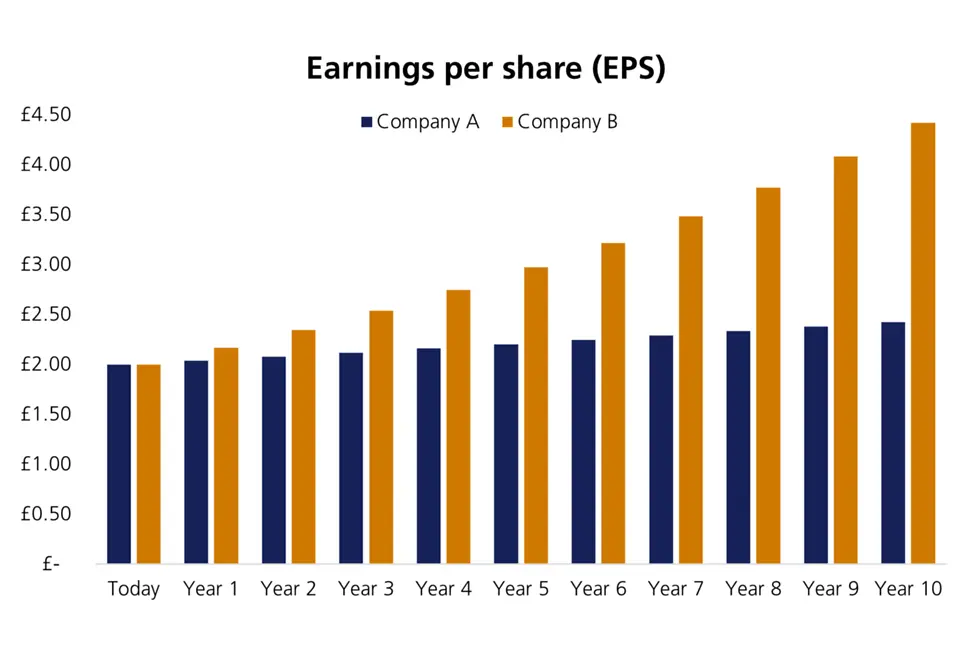
While both companies grew sales at the same rate, Company B grew EPS by 6.3% more per year than Company A. This means after ten years Company B’s EPS was 82% higher than Company A.
The contrast is striking. Both companies delivered exactly the same operational performance, yet the experience for shareholders diverged significantly. Company A’s earnings grew, but those earnings were spread out across far more shares, muting existing investors’ returns. Company B, on the other hand, concentrated those earnings among fewer shares, amplifying EPS growth.
There’s a myriad of other influences that can affect a company’s fortunes and profitability, but how a company manages the share count can vastly affect the outcome for shareholders. It’s not just about the pie growing but making sure that your slice grows with it.
The impact is easy to overlook in theory, but the significance becomes much clearer when we look at real-world companies. To illustrate how changing share counts can shape shareholder outcomes, let’s examine two well-known tech giants: Salesforce and Apple.
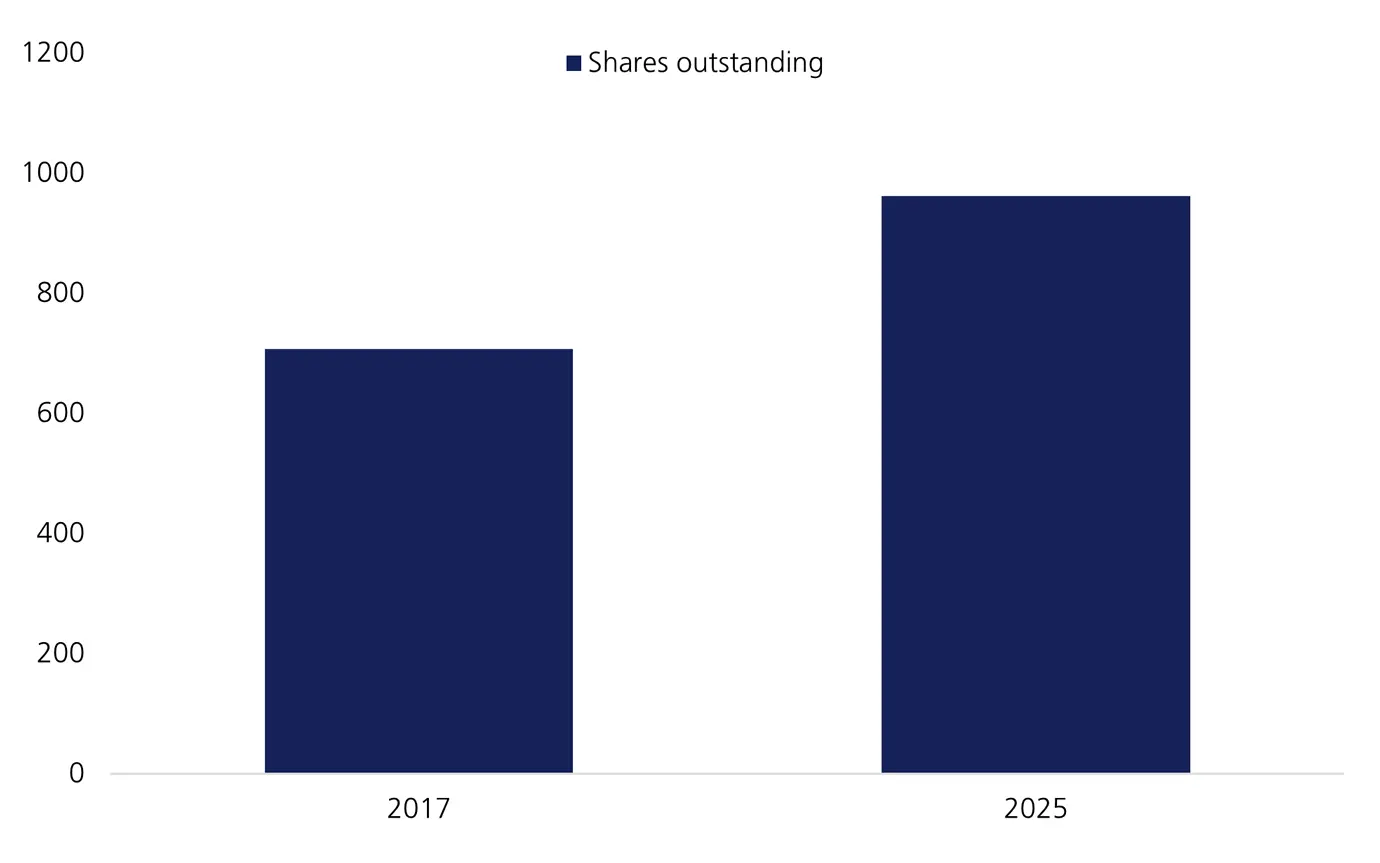
Over the last 8 years Salesforce has grown its sales from $8.4 billion in 2017, to a whopping $37.9 billion in 2025, an impressive annual growth rate of 21% - a truly astonishing figure.
Over that period, Salesforce has grown its share count from 708 million in 2017 to 962 million in 2025 – 36% more shares, representing a growth rate of 4% per year.
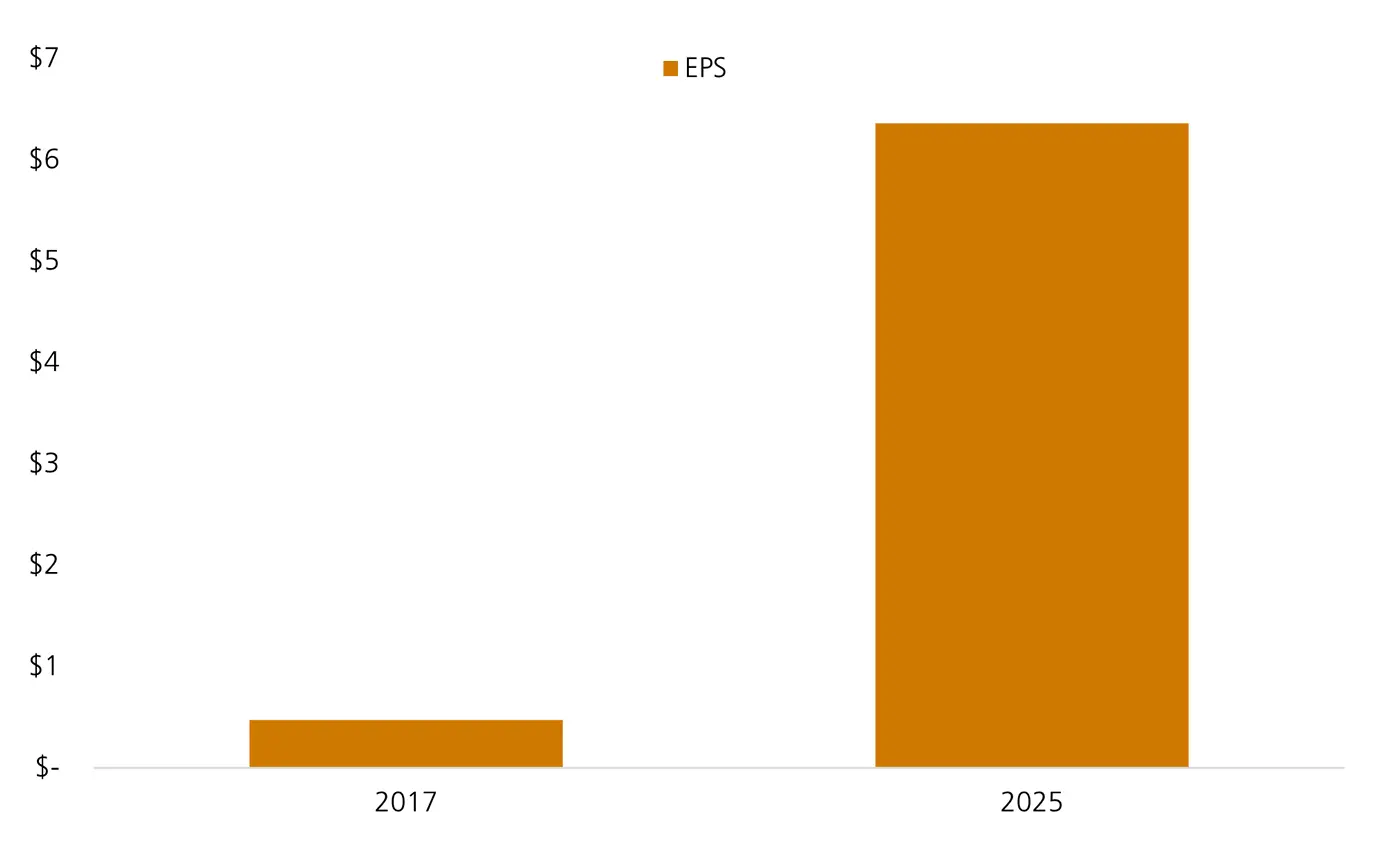
EPS was $0.47 in 2017 and ballooned to $6.36 in 2025, another impressive annual growth rate of 39%. However, if Salesforce had kept their share count constant over those years, EPS would now be $8.65 in 2025, 36% higher than what it is today.
Share-based compensation or using shares instead of cash for acquisitions is part of doing business, but it does come at a cost. Because more shares have been issued, Salesforce shareholders have seen much slower growth in EPS than they would have if their ownership stake in the company had not been diluted.
|
|
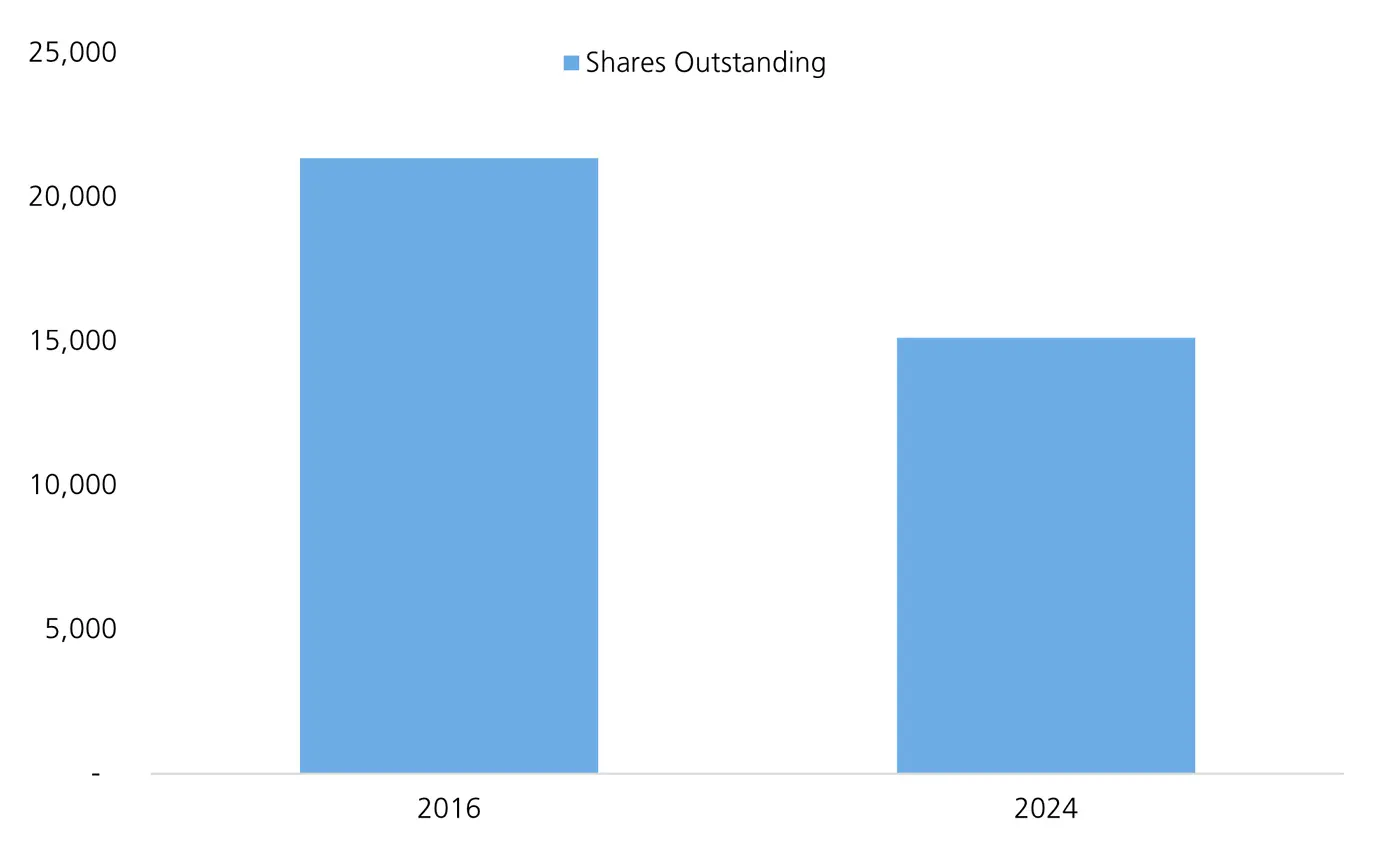
On the other side of the coin is Apple, one of the world’s most valuable companies. Apple grew sales from $215 billion in 2016 to $391 billion in 2024 – an 7.8% annual growth rate, and still impressive even though it is much less than what Salesforce achieved.
But over that period, Apple has allocated over $600 billion of capital to buying back their own shares and reducing their share count. The company had 21.3 billion outstanding shares in 2016, which have been brought down to 15.1 billion in 2024, representing a -29% reduction overall or -4% per year.
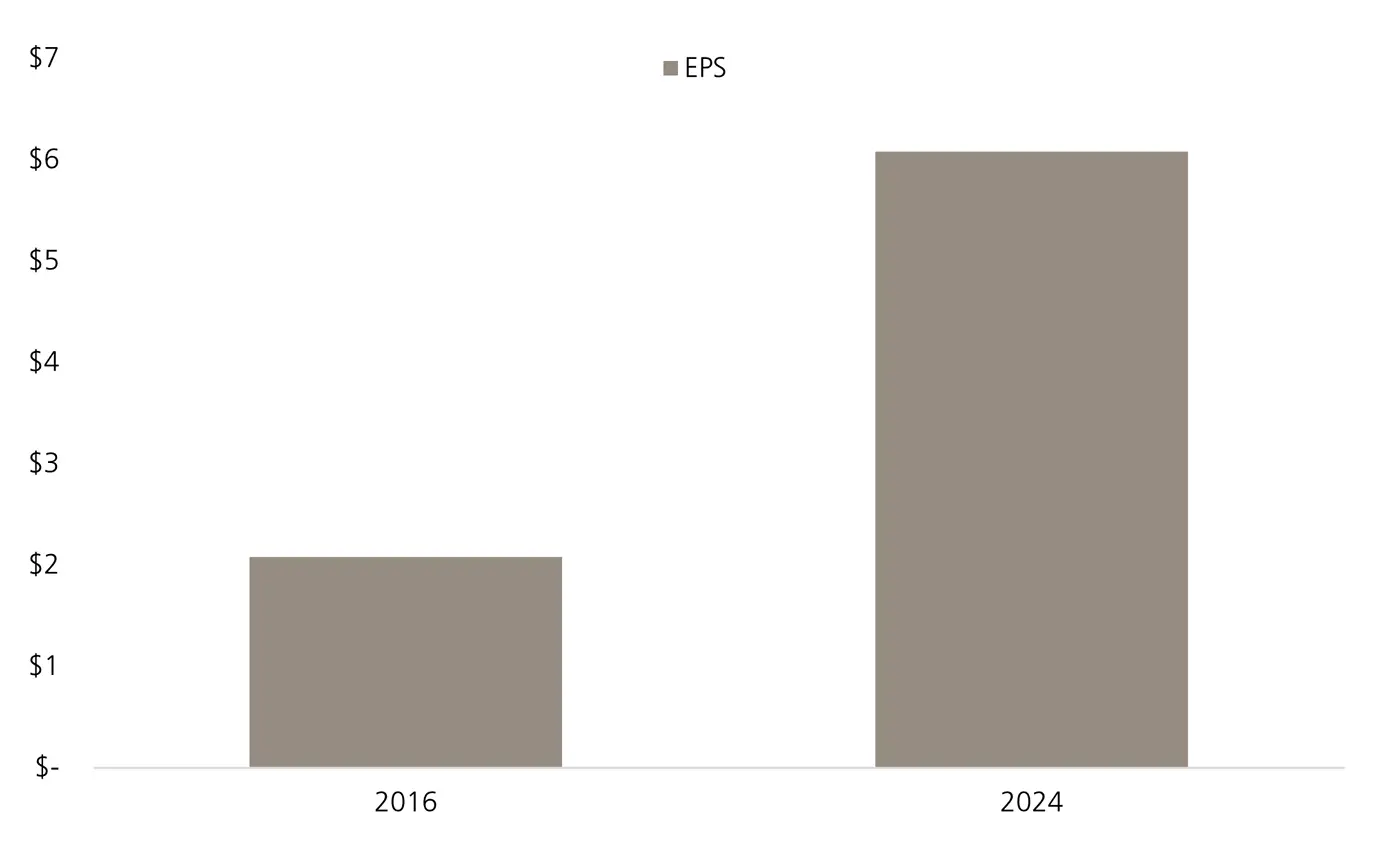
Apple’s EPS has grown from $2.08 in 2016 to $6.08 in 2024 – representing 193% growth over that period, or 14.3% growth annually. Apple’s EPS grew almost twice as fast as their sales.
|
|
Apple’s significant share buybacks mean there are now fewer outstanding shares, so each remaining share represents a larger ownership stake in the company and a greater share of earnings. In other words, existing Apple shareholders have been rewarded not only with a much larger overall pie, but also a bigger slice.
The lesson here isn’t that share issuance is inherently bad or that buybacks are always good. Companies at different stages require different strategies, and sometimes issuing shares is the right move to fuel growth or secure talented employees. But as a shareholder, it is essential to understand the trade-off. A company can report impressive headline growth while your actual stake in that success diminishes every year. The pie gets bigger, but your slice may not. This is why looking beyond revenue and profit growth matters. Share count reveals a lot about how management thinks about shareholders. And when you invest in a company, you’re not just betting on its ability to grow. You’re trusting management to grow your slice of it.
This communication is provided for information purposes only. The information presented herein provides a general update on market conditions and is not intended and should not be construed as an offer, invitation, solicitation or recommendation to buy or sell any specific investment or participate in any investment (or other) strategy. The subject of the communication is not a regulated investment. Past performance is not an indication of future performance and the value of investments and the income derived from them may fluctuate and you may not receive back the amount you originally invest. Although this document has been prepared on the basis of information we believe to be reliable, LGT Wealth Management UK LLP gives no representation or warranty in relation to the accuracy or completeness of the information presented herein. The information presented herein does not provide sufficient information on which to make an informed investment decision. No liability is accepted whatsoever by LGT Wealth Management UK LLP, employees and associated companies for any direct or consequential loss arising from this document.
LGT Wealth Management UK LLP is authorised and regulated by the Financial Conduct Authority in the United Kingdom.